
Measures of Central Tendency
Measures of Central Tendency: Overview
This Topic covers sub-topics such as Measures of Central Tendency, Mean for Grouped Data, Median of Grouped Data, Weighted Arithmetic Mean, Combined Mean, Mode of Grouped Data, Properties of Arithmetic Mean and, Properties of Median
Important Questions on Measures of Central Tendency
Give one example in which the mean is an appropriate measure of central tendency.
The median of is _____?
Calculate the fourth term.
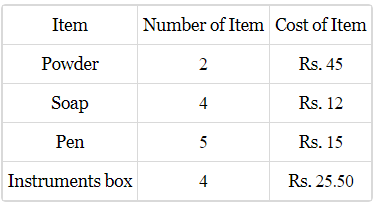
Find the weighted arithmetic mean of the following data.
If the mean, median and mode coincide, then it is a
Find out the mode of the following frequency distribution by the graphical method :
| Expenses (In Rs) | |||||
| No . of families |
The measure of central tendency which is given by the x-coordinate of the point of intersection of the 'more than' ogive and 'less than' ogive is
The following distribution give the daily income of workers of a factory.Draw the ogive of a "less than type' cumulative frequency distribution and hence obtain the median daily income.
| Daily income | ||||||
| Number of workers |
Find the combined mean from the following data
Find the combined mean from the following data
The mean of numbers is . If is added to every number, what will be the new mean?
The mean of numbers is . If is added to every number, what will be the new mean?
Arjun rolled a die a number of times and recorded her results in a bar graph, as follows:
![[image]](https://sss.embibe.com/cdn-cgi/image/q=75,f=auto,fit=scale-down/https://sss.embibe.com/content-grail/preprod/306bb32a-2b7a-41b0-8fd9-5924ac5398ee.gif)
What was the median score?
A taxi driver records the distances of his journeys, to the nearest km, over the course of a long weekend shift.
| Distance | |||||
| Frequency |
The modal class is
Which of the following cannot be determined graphically?
The following table shows the number of students and the time they utilised daily for their studies. Find the mean time (in ), spent by students for their studies:
| Time | No. of students |
Calculate the median of the following frequency distribution table :
| Class-interval | Frequency |
Find the mean age of residents of a colony from the following data.
|
Age (in years) |
|||||||
| No. of Persons |
Find the mode from the following information: .
The following table shows the number of students and the time they utilised daily for their studies. Find the mean time (in ), spent by students for their studies:
| Time | No. of students |


